Technical Analysis Tools Every Intraday Trader Should Use in 2024

Intraday trading in the Indian stock market can be thrilling and potentially profitable. However, to succeed, traders need the right tools to help them make informed decisions. Technical analysis is a crucial part of intraday trading, and in 2024, there are several powerful tools that every trader should know about and use. This blog will explore these essential technical analysis tools, explaining how they work and why they’re important for intraday traders in India.
What is Technical Analysis?
Before we look at specific tools, let’s understand what technical analysis is. Technical analysis is a way of studying price movements and patterns in the stock market. It helps traders predict future price movements based on past market data. Fundamental analysis looks at a company’s financial health whereas technical analysis focuses on charts and statistical indicators.
Essential Technical Analysis Tools for Intraday Trading
Intraday trading requires quick decisions and precise strategies. To succeed, traders rely on various technical analysis tools. These tools help analyse market trends, price movements, and trading volumes. Here are the essential technical analysis tools for intraday trading:
1. Candlestick Charts
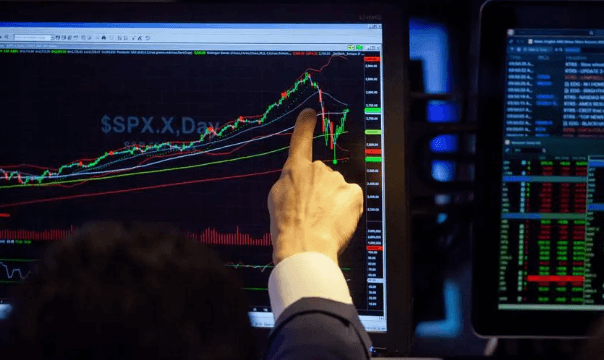
Candlestick charts are one of the most popular and useful tools for online share trading. They show the opening, closing, and high and low prices for a stock in a single period, usually a day or an hour for intraday trading. Each candlestick on the chart looks like a rectangle with lines sticking out from the top and bottom. The rectangle (called the ‘body’) shows the opening and closing prices. If the body is green or white, it means the stock price went up during that period. If it’s red or black, the price goes down. The lines (called ‘wicks’ or ‘ shadows’) show the highest and lowest prices reached during that time. Candlestick charts help traders spot patterns that might suggest where the price is heading next. For example, a ‘doji’ candlestick, where the opening and closing prices are very close, often signals a potential change in trend.
2. Moving Averages
Moving averages are an important tool for intraday traders in India. Traders often use moving averages to identify trend direction, potential support, and resistance levels. For example, if a stock price is above its 20-day moving average, it’s generally considered to be in an uptrend.
Mainly there are two types of moving averages:
- Simple Moving Average (SMA): This is the average price over a set number of periods.
- Exponential Moving Average (EMA): It gives more weight to recent prices and it makes them more responsive to new information.
3. Relative Strength Index (RSI)
The Relative Strength Index, or RSI, is a momentum indicator that measures the speed and change of price movements. It oscillates between 0 and 100 and is typically used to identify overbought or oversold conditions in a traded security. In the Indian market, traders often consider an RSI above 70 as overbought (meaning the stock might be due for a price drop) and below 30 as oversold (suggesting the price might rise soon). However, in strong trends, these levels might need to be adjusted. The RSI can be particularly useful to trade intraday and helps spot potential reversal that points to short-term price movements.
4. Bollinger Bands
Bollinger Bands are a versatile tool that can help intraday traders identify potential buy and sell signals. They consist of three lines:
- A middle band, which is usually a 20-period simple moving average
- An upper band, which sets two standard deviations above the middle band
- A lower band, that sets two standard deviations below the middle band
The bands expand when the market is volatile and contract when it’s calm. Traders often look for ‘squeezes’ (when the bands come close together) as potential signs of an upcoming big move in price. In the Indian market, many traders use Bollinger Bands to spot potential breakouts. When the price moves close to the upper band, it might be a sell signal, and when it’s near the lower band, it could be a buy signal.
See also: The Impact of Seasonal Changes on Pest Activity in Toronto Homes
5. Volume Indicators
Volume is a crucial aspect of technical analysis, especially for intraday trading. It shows how many shares have been traded in a given time. High volume often indicates a strong interest in a stock. One popular volume indicator is the on-balance volume (OBV). It adds volume on up days and subtracts it on down days, creating a running total. If the OBV is rising while the price is falling, it might suggest that the price will eventually rise to match the OBV. For intraday traders in India, volume indicators can help confirm trends and spot potential reversals. A price move with a high volume is generally seen as more significant than one with a low volume.
Conclusion
These technical analysis tools are essential for any intraday trader in the Indian market in 2024. They provide valuable insights into price trends, momentum, and potential reversal points. However, it’s important to remember that no single tool is perfect. Successful traders often use a combination of these tools, along with their experience and market knowledge, to make trading decisions. As you explore these tools, start by focusing on one or two that you find most intuitive. Practice using them with historical data or in a paper trading account before risking real money. Over time, you’ll develop a feel for how these tools work in different market conditions. Remember, while these tools can provide valuable information, they’re not crystal balls. Always use them as part of a broader trading strategy that includes proper risk management. With practice and patience, these technical analysis tools can significantly enhance your intraday trading in the vibrant Indian stock market.


